Learn · Unit plans · Grade 11 · Environmental Science · SVN3M / SVN3E
Grade 11 Environmental Science: testing the water
A fieldwork unit for SVN3M and SVN3E: plan, sample, test and report on local water, alongside open data from the map.
lessons of about 75 minutes, including two field sessions and two for the report.
SVN3M's field or lab study of pond, river or lake water. SVN3E's B2.3 asks students to compare water quality.
Students check their own results against years of community and government data on the map.
Why this unit
Both Grade 11 Environmental Science courses ask students to test water themselves: SVN3M's field or lab study of water samples (C2.3), and SVN3E's inquiry comparing water quality in natural and disturbed environments (B2.3), with sampling and monitoring methods (B3.3). This unit gives the fieldwork a frame: what to test and why, how to design a fair sampling plan, how to read the results against long-term open data from the map's Water quality layer, and how to report them to someone who can use them.
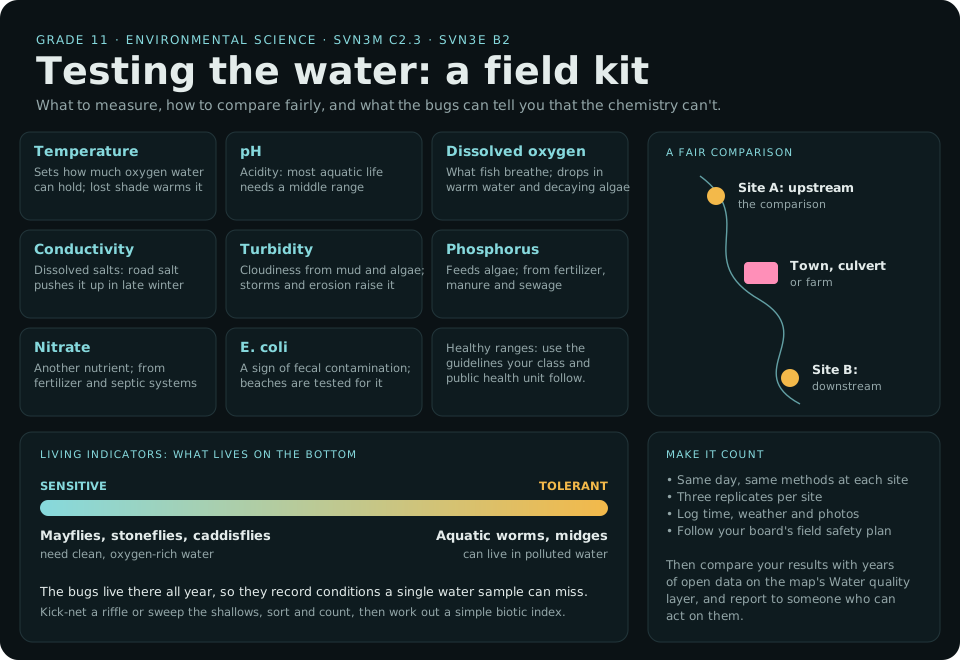
Text version and sources
- Indicators: temperature (sets how much oxygen water can hold); pH (acidity); dissolved oxygen (what fish breathe); conductivity (dissolved salts, including road salt); turbidity (cloudiness from mud and algae); phosphorus and nitrate (nutrients that feed algae); E. coli (a sign of fecal contamination; public health units test beaches for it). Use the guidelines your class and public health unit follow for healthy ranges.
- A fair comparison: sample upstream and downstream of a town, culvert or farm, on the same day with the same methods, with three replicates per site, logging time, weather and photos, under your board's field safety plan.
- Living indicators: mayflies, stoneflies and caddisflies need clean, oxygen-rich water; aquatic worms and midges tolerate pollution. Bottom-dwelling invertebrates live there all year, so they record conditions a single water sample can miss.
- Making it count: compare your results with years of open data on the map's Water quality layer (DataStream), and report them to someone who can act on them.
Sources: DataStream: open water-quality data; Government of Ontario: water quality and blue-green algae; U.S. EPA: Great Lakes. More in Algae and water quality.
Expectations covered
| Code | In brief | Lessons |
|---|---|---|
| SVN3M C2.3 · SVN3E B2.3 | A field or lab study of water quality, comparing sites (indicators such as pH, dissolved oxygen, turbidity, BOD and coliforms) | 1, 4–6 |
| SVN3E B3.3 | Sampling and monitoring methods | 3 |
| SVN3M C2.2 | Analyse longitudinal data | 2, 7 |
| SVN3E E2.4, E3.6 | An inventory of a local environment, and monitoring aquatic biodiversity | 6 |
| SVN3E B3.5, B3.6 | Impacts on aquatic ecosystems (runoff, spills) and invasive species | 8 |
| SVN3M C1.1, C1.2 · C3.3 | Grassroots and government initiatives for clean water; E. coli at beaches | 8 |
| SVN3M D2.6 | Local landscaping and restoration (example: riparian restoration) | 8 |
Codes and summaries are paraphrased from Environmental Science, Grade 11, University/College (SVN3M) and Workplace (SVN3E), 2008. Choose the codes for your course. Check the full wording on the Ontario Curriculum and Resources site.
The lessons
-
Why test water? C2.3 / B2.3
Read: Algae and water quality and Pollution and clean water (Students and Adults).
Do: Make an indicator table: temperature, pH, dissolved oxygen, conductivity, turbidity, phosphorus, nitrate, E. coli. What does each tell you, what's a healthy range, and what pushes it up or down?
-
Reading other people's data SVN3M C2.2
Read: Doing science with the data.
Live: Switch on Water quality under More. Find the monitoring site nearest your planned sampling site. Record its results, dates, units and the group that collected them.
Do: Graph one measurement over time. What would you need to know before comparing it with your own results?
-
Designing a fair sampling plan SVN3E B3.3
Do: Choose at least two sites (for example upstream and downstream of a town, a culvert or a farm), the tests, the timing and the replicates. Write the field safety plan with your board's procedures, and get it approved.
-
Field day: sampling and field tests C2.3 / B2.3
Do: Collect samples and take field measurements: water and air temperature, pH, dissolved oxygen, conductivity and turbidity (a transparency tube works well). Record everything in a field log, with photos of each site.
-
Lab: nutrients and bacteria C2.3, C3.3
Do: Test phosphate and nitrate with test kits, and culture coliforms and E. coli on plates, following your school's lab safety and disposal procedures. Compare with the provincial recreational water guideline your public health unit uses.
-
Living indicators: benthic invertebrates SVN3E E2.4, E3.6
Do: Kick-net or sweep a riffle or the shallows, sort and count the invertebrates, and work out a simple biotic index. Mayflies, stoneflies and caddisflies are sensitive to pollution; worms and midges are tolerant. What do the bugs say that the chemistry doesn't?
-
Your data and the long record SVN3M C2.2
Live: Put your results beside the DataStream site's history, and, near the lakes, the live Algae sensors.
Do: Are your results typical, or unusual? Give two reasons a single sampling day might mislead.
-
Impacts and solutions B3.5, B3.6, C1.1, C1.2, D2.6
Read: Road salt, sewer overflows and source protection in Pollution and clean water, and invasive species in Fish and food webs.
Do: Link each result that concerned you to a likely cause, and to a real solution: a riparian buffer, stormwater ponds, salt management, a source protection policy.
-
Culminating task: a water-quality report C2.3 / B2, with C1
Over two lessons, students write a short report for a real audience: the conservation authority, the municipality, a local stewardship group or the school community. It includes:
- the question, the sites and the methods, so someone else could repeat them;
- the results as tables and graphs, with units and uncertainty;
- a comparison with the long-term open data;
- conclusions, limitations, and a recommendation.
Classes that sample regularly can partner with a local monitoring group and share their data openly through DataStream, so the next class, and everyone else, can build on it.
Assessment
- For learning: the indicator table and the sampling plan, checked before the field day.
- As learning: the field log and lab notebook.
- Of learning: the water-quality report, across the four achievement chart categories.
Connections
- Grade 8: the Water Systems unit introduces the same indicators.
- Specialist High Skills Major, Environment: stream assessment and watershed management.
Fieldwork safety. Plan every trip to the water under your board's field trip, water-safety and science-safety policies. Handle bacterial cultures and test reagents as your school's lab procedures require. In The Lakes doesn't give safety advice.
Before you start
- Many buoys come out of the water from late October to May, so the number reporting changes with the season. Water-quality samples are hand-collected snapshots, not live readings.
- Turn on Teacher view under the level tabs on any Learn topic (or add
#allto its address) to see the Kids, Students and Adults levels together while you plan. - In The Lakes is a simulation for learning, not for navigation, and doesn't give safety or health advice. For any trip to the water, follow your board's field trip and water-safety policies.
Tell us how this unit works in your class, or what's missing: admin@inthelakes.ca.
For teachers
Using this in class? Tell us
A minute of your time helps keep In The Lakes free: it shows funders and partners that classes really use it, and tells us what to improve.
This form needs JavaScript. You can also write to admin@inthelakes.ca.
How these lessons are made
Each lesson and unit plan is researched and drafted with the help of AI tools, and edited by the site's creator. Every lesson lists its sources, so you can check it for yourself. Figures are rounded. Curriculum links are a planning aid, not an official alignment. Ontario teachers who review a unit are thanked on that unit. This is a living project: spotted a mistake, or know more? Tell us, or help improve it. admin@inthelakes.ca