Learn · Unit plans · Grade 8 · Science and Technology · Strand E
Grade 8 Water Systems, with live Great Lakes data
A ready-to-teach unit for Science and Technology Grade 8, strand E, built on the lakes outside the classroom.
lessons of about 60–75 minutes, including two for the culminating task.
Every expectation in the Water Systems strand, E1.1 to E2.7.
accounts or installs. A browser on a laptop, Chromebook or tablet is all students need.
Why this unit
The Grade 8 Water Systems strand asks students to understand water "both locally and globally": watersheds, how bodies of water change the weather, water quality, how towns treat and manage water, and how to plan for freshwater sustainability. In Ontario, the nearest big water system is almost always a Great Lake. This unit uses the lakes as the case study and the live map as the lab: real buoy readings, river flows, water-quality samples, satellite water temperature, ice charts and water levels, all updated as the class works.
Each lesson points to a Learn lesson at the Students level. Turn on Teacher view under the level tabs on any lesson (or add #all to its address) to see all three levels at once while you plan.
Text version and sources
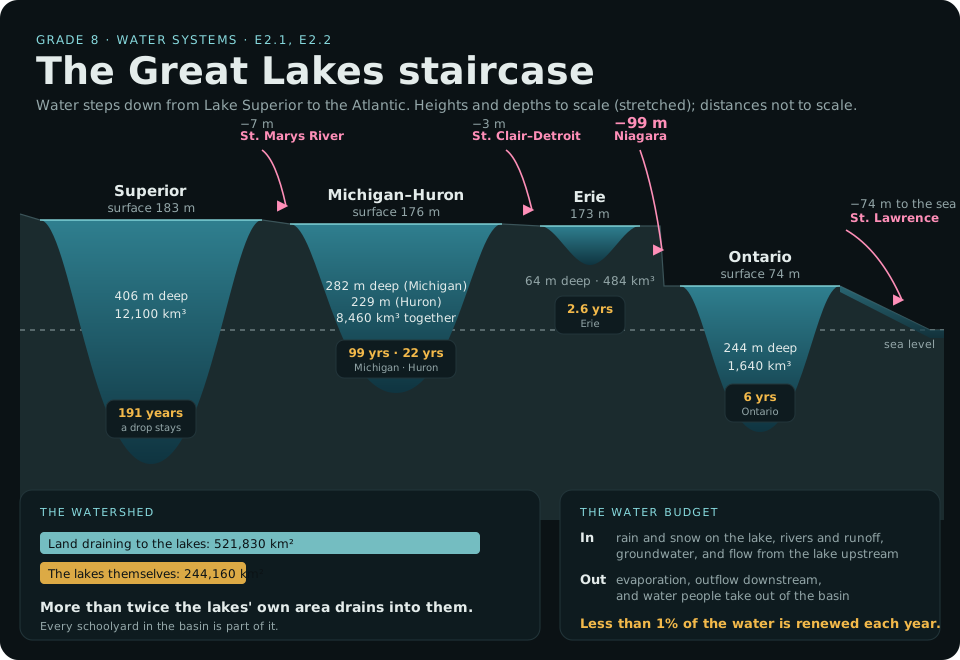
- Surfaces (at low water datum): Superior 183 m above sea level, Michigan–Huron 176 m, Erie 173 m, Ontario 74 m.
- Drops between them: the St. Marys River about 7 m, the St. Clair–Detroit system about 3 m, the Niagara River about 99 m (much of it at the Falls), and the St. Lawrence about 74 m to the sea.
- Greatest depths and volumes: Superior 406 m and 12,100 km³; Michigan 282 m and 4,920 km³; Huron 229 m and 3,540 km³; Erie 64 m and 484 km³; Ontario 244 m and 1,640 km³. Superior's deepest point is about 220 m below sea level.
- How long water stays (retention time): Superior 191 years, Michigan 99, Huron 22, Ontario 6, Erie 2.6.
- Watershed: 521,830 km² of land drains to the lakes, more than twice their 244,160 km² of water surface.
- Water budget: in come precipitation on the lake, runoff from rivers, groundwater and inflow from upstream; out go evaporation, outflow and water taken out of the basin. Less than 1% of the water is renewed each year.
Sources: U.S. EPA: physical features of the Great Lakes (areas, depths, volumes, retention times, drainage area); NOAA GLERL: physical characteristics of the Great Lakes (surface elevations); Michigan EGLE: less than 1% of the water renewed each year. More in Rivers and watersheds.
Expectations covered
| Code | In brief | Lessons |
|---|---|---|
| E1.1 | Assess the impact of fresh-water scarcity, and plan action for fresh-water sustainability | 9–10 |
| E1.2 | First Nations, Métis, and Inuit knowledges and values about water, and sustainable water management | 7 |
| E1.3 | The impact of discoveries and technologies on local and global water systems | 8 |
| E2.1 | The states, distribution, amount and circulation of water on Earth | 1 |
| E2.2 | What a watershed is, and why it matters for water management and planning | 2 |
| E2.3 | What changes the water table | 6 |
| E2.4 | Melting glaciers and ice, and climate change | 6 |
| E2.5 | How bodies of water change atmospheric conditions | 3 |
| E2.6 | Indicators of water quality, and human impacts on them | 4 |
| E2.7 | How municipalities process water and manage its use | 5 |
Codes and summaries are paraphrased from the Grade 8 Science and Technology curriculum (2022). Check the full wording on the Ontario Curriculum and Resources site. Strand A (STEM skills, including scientific research and experimentation) runs through every lesson.
The lessons
-
Where is Earth's water? E2.1
Read: Great lakes of the world (Students), and the water budget in Rivers and watersheds.
Do: Use the lake table to compare the Great Lakes with Baikal, Tanganyika and the Caspian by volume and depth. Work out each lake's average depth (volume ÷ area). Then sketch the water cycle for one Great Lake: what comes in, what goes out, and how long a drop stays (residence time).
Check: Why can a lake with a small area hold more water than a much wider one?
-
Your watershed E2.2
Read: Rivers and watersheds (Students).
Live: On the map, open More and switch on Watershed and Rivers. Find your school: which lake does your schoolyard drain to, and which river gets it there? Tap the river for today's flow compared with normal for the time of year.
Do: Draw your watershed's path from schoolyard to lake to the Atlantic. List three things upstream that could change the water before it reaches you, and who decides about each (see Who looks after the lakes).
-
Lakes make weather E2.5
Read: Lake-effect snow and the lake breeze in Storms and weather (Students).
Live: Switch on Water temp, then tap three buoys and compare each one's water and air temperature. Which way is heat moving, from the water to the air or the other way? (Forecasters look for the air about 1.5 km up to be roughly 13 °C colder than the lake before lake-effect snow; the buoy's air temperature is only a first clue.) In late fall or winter, check Satellite for snow bands downwind.
Do: Explain, with a labelled diagram, why towns east of Lake Huron get more snow than towns west of it, and why a lakeshore town is cooler on a June afternoon.
-
Is the water healthy? E2.6
Read: Algae and water quality (Students).
Live: Open More and switch on Water quality (hand-collected samples shared on DataStream) and Algae (live sensors). Pick one stream in a city and one in farm country or forest. Compare dissolved oxygen, phosphorus, conductivity (salts), turbidity and E. coli, with the date each sample was taken.
Do: Make a two-column table of indicators, what each tells you, and the human activity that pushes it up or down. Which differences can you explain, and what would you need to make the comparison fair?
-
From lake to tap E2.7
Read: "Lake to tap" and "Walkerton: protecting the source" in Pollution and clean water.
Do: Find out where your town's drinking water comes from (a lake intake, a river or wells) and how it's treated, using your municipality's annual drinking water report. Map the source on the Watershed layer. Then track your household's water use for two days and compare.
Check: What is the "multi-barrier" approach, and where is the first barrier?
-
Changing waters E2.3, E2.4
Read: A changing climate, Ice and Water levels (Students).
Live: Switch on Ice in winter or Water temp in summer, and open Water levels: how far is today's level above chart datum, and how does it compare with the record lows and highs described in Water levels and A changing climate?
Do: Explain how groundwater and the water table connect to rivers and the lakes (a wet spring, a dry summer, pumping wells), and how less ice changes evaporation and water levels.
-
Knowledges of water E1.2
This expectation is best taught from Indigenous voices. Learn doesn't summarize Indigenous knowledge: see Indigenous relationships with the lakes for why.
Do: Use the map's Indigenous view to find whose traditional territory and which treaty your school is on. Then learn from that nation's own education resources, or invite a local knowledge keeper or Indigenous educator, on their terms, through your school board's Indigenous education lead. Students reflect on responsibilities to water, alongside the science of the unit.
-
How we know E1.3
Read: Buoys and sensors and Doing science with the data (Students). Tour the 3D buoy.
Do: Compare what we knew about a lake before buoys, satellites and models with what we know now. Which technology would you add next, and what question would it answer?
-
Culminating task: a freshwater action plan E1.1, with all of E2
In small groups, students choose a real issue in their own watershed: a stream with high E. coli or salt, an algae problem, a flooding shoreline, water use at school, or a drinking-water source. Over two lessons they:
- gather evidence from at least two map layers or datasets, with dates and sources (a data log, see Doing science with the data);
- explain the science: the watershed, the indicators, and what is causing the change;
- consider whose water it is and who is responsible: the municipality, the conservation authority, the province, First Nations and the people upstream and downstream;
- propose a realistic plan of action, including something the class itself can do, and how they would know if it worked;
- present it to the class, or to a local audience such as the school council, the municipality or the conservation authority.
Assessment
- For learning: each lesson's Check question, used as an exit ticket.
- As learning: a running data log (date, station, value, unit, measured or estimated, source) kept across the unit, with a short reflection after lessons 3, 4 and 6.
- Of learning: the action plan, assessed across the four categories of the provincial achievement chart: Knowledge and Understanding (the water science), Thinking and Investigation (the evidence and its limits), Communication (the presentation and data displays), and Application (a realistic plan and its effects on people and the environment).
Connections
- Mathematics, Grade 8 Data: plot water temperature against air temperature from several buoys as a scatter plot, and discuss the relationship.
- Geography, Grade 8: Global Settlement A3.2 and A3.5, water for transportation and industry, and water pollution.
- Science, Grade 8 Fluids: C1.2, the impacts of spills, using Commercial shipping and Pollution and clean water.
Before you start
- Many buoys come out of the water from late October to May, so the number reporting changes with the season. Winter is the time for ice and lake-effect snow; spring and fall for algae, upwelling and water quality.
- Water-quality samples are taken by hand on the dates shown; they're snapshots, not live readings.
- In The Lakes is a simulation for learning, not for navigation, and doesn't give safety or health advice. For any trip to the water, follow your board's field trip and water-safety policies.
Tell us how this unit works in your class, or what's missing: admin@inthelakes.ca.
For teachers
Using this in class? Tell us
A minute of your time helps keep In The Lakes free: it shows funders and partners that classes really use it, and tells us what to improve.
This form needs JavaScript. You can also write to admin@inthelakes.ca.
How these lessons are made
Each lesson and unit plan is researched and drafted with the help of AI tools, and edited by the site's creator. Every lesson lists its sources, so you can check it for yourself. Figures are rounded. Curriculum links are a planning aid, not an official alignment. Ontario teachers who review a unit are thanked on that unit. This is a living project: spotted a mistake, or know more? Tell us, or help improve it. admin@inthelakes.ca